
Visualization as a tool for dialogue in conflict regions
With a flipchart on my motorcycle, I reach remote border villages in northwestern Côte d’Ivoire. There it becomes clear: visualization can enable dialogue, build understanding, and mobilize communities toward shared solutions—even where words alone are not enough.

Pencil Selling: How visual thinking changes the way we sell complex services
Ever tried to explain something over the phone that felt almost impossible to describe with just words?
At bikablo, we believe in enabling people to think with the pen—even in banking, insurance, or tech. In situations where people need to explain complex products or services, a quick sketch—on a tablet or paper—can make all the difference.
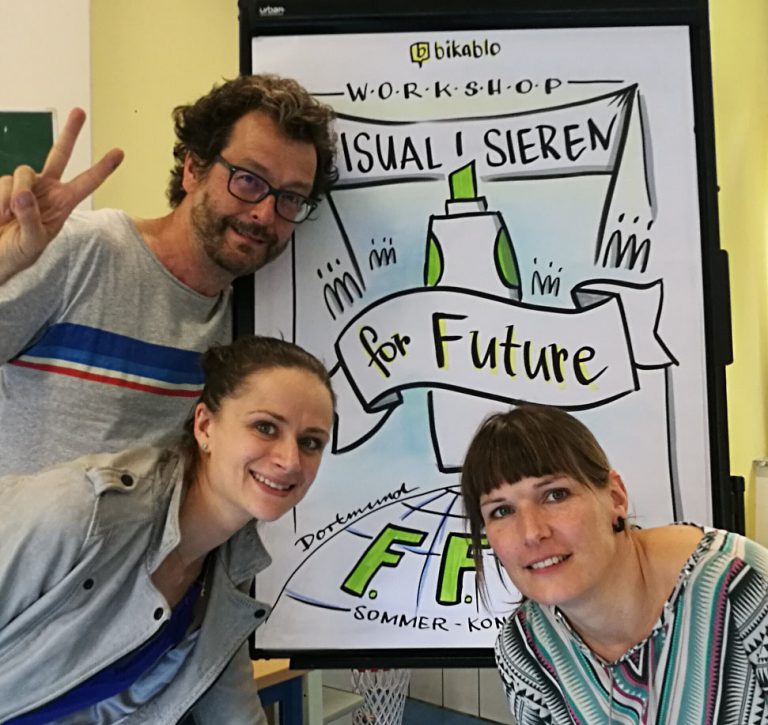
Using pictures to promote a good climate: bikablo meets Fridays For Future
With “Fridays for Future” a fascinating worldwide youth movement has emerged. bikablo supported the summer congress in Dortmund with graphic recording and visualization trainings.