What is that actually – visual thinking?
This question occupies me every day. Images are everywhere: in our thoughts, in our language, in our movements (even gestures are images!) and in our environment. We can use all of this to develop better solutions in dialogue.
For me, it’s always a special adventure: a conversation with a customer or a colleague. I sketch along on the iPad. The person I’m talking to suddenly discovers a new pattern, a new perspective, a new approach to a solution in the images that emerge. The right questions play a decisive role. The images they contain. And the images they evoke. It is not about how “perfectly” something is drawn. It’s about what resonance a visualization generates in conversation. This can be a structured presentation of the content (“I’ve summarized our thoughts here. What pattern do you recognize?”), a simple graphic form (“how does your development feel right now?”), a picture metaphor (“You mean this offer is like a bridge to the future. How exactly can I imagine this bridge?”) or something completely different that emerges emergently in dialogue. For me, this is an incredibly exciting field of research!
Our mission: to create a common understanding
I try to use visualization to get to the heart of complex issues. For example, on the question of how visualization actually works. This model was created for this purpose.
Visualization should always serve a common understanding – on three levels:
- We have a common understanding of existing knowledge, i.e. numbers, data, facts and what each person brings to the table.
- We get a common understanding about emerging knowledge, i.e. ideas, goals, plans, visions and strategies.
- And – we see ourselves as people. That is the basis for everything else.
An exciting observation:
As soon as I have scribbled such a model on the proverbial beer mat in my own flow of thoughts, new thoughts arise as I look at it: What is missing from the model? What could still be a benefit? What takes place above, what takes place below?
The most beautiful thing is making books!
How happy and grateful I am again and again to have the opportunity to make books. In my first job as a communication designer, I was passionate about creating beautiful books. Now I can also contribute valuable content, in text and images.
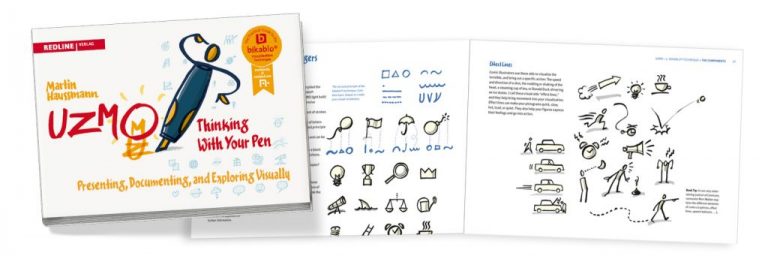
Whether it’s our bestsellers, the “Visual Dictionaries” or the practical book “UZMO – Thinking with the Pen” – a lot of time passes from the first idea to the finished printed copy. In the case of UZMO, it took 5 years. Many people are involved, especially my colleagues and friends from the bikablo team and the visualization community around our brand.
With each new book, new visualization techniques, methods and images emerge. The creative systematization of knowledge is great fun for me.
And then, once again, when a new bildwerk customer or an enthusiastic training participant answers the question “How do you know us?”
“Someone once gave me a book from you. It opened the door to a new world for me!” – Then I know that all the effort was worth it.
Trainings from Martin Haussmann
STORIES
Blog posts recommends by Martin Haussmann

Closer than we thought: Visualization and Comics
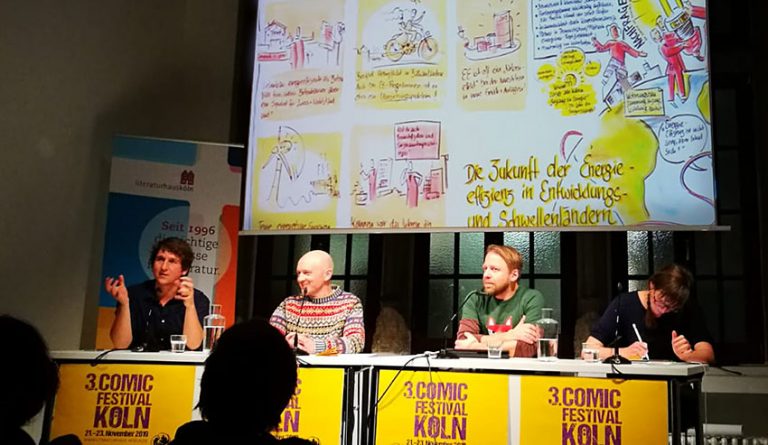
What do graphic novels and graphic recording have in common? This is the question bikablo asked itself in a conversation with the comic artist Oliver Scheibler at the Comic Festival in Cologne. An experience report with surprising insights.

The digital grab bag
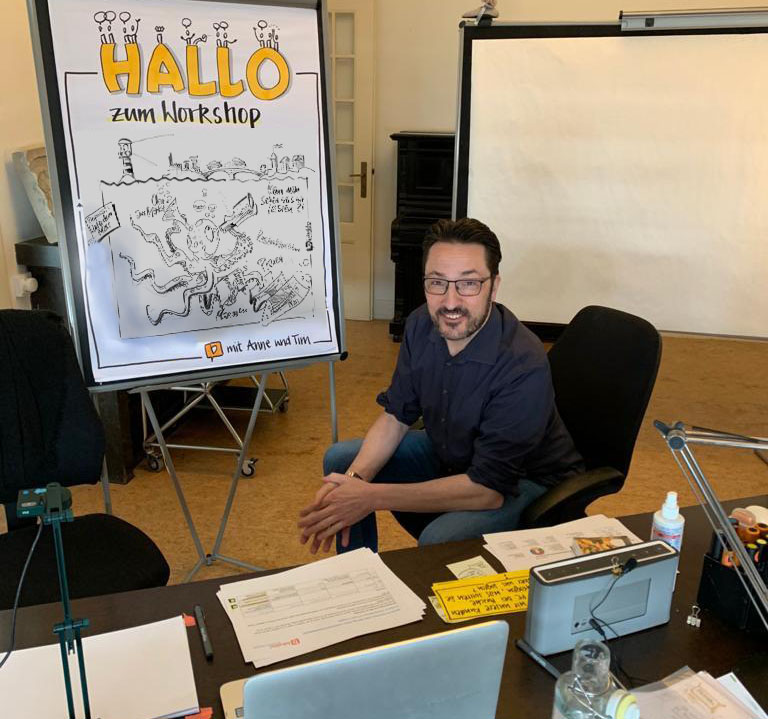
A strategy image workshop spontaneously switched to online by bikablo bildwerk enabled surprising insights: Here are the five most important takeaways on virtual collaboration.

UZMO – Thinking With Your Pen – The bikablo-Visualisation Guide now in English!
“UZMO – Thinking With Your Pen”, our standard work for Visual Storytelling, Visual Facilitation, Graphic Recording and Sketchnoting is now available in English!
