Clusters, Chunks and Hierarchies – Three Rules for Poster Visualization

Our modern business world is often dominated by complicated structures. If we want to change or optimize these, we first have to understand them – and this is not always an easy task! Using posters to visualize complex topics or processes is an ideal way to bring clarity to the seemingly incomprehensible. Here are some tips for what to pay attention to when preparing a visual presentation.

by Martin Haussmann

SHARE ARTICLE

My great-grandfather was a carpenter. Using just a few tools, he built tables, cupboards, and cabinets – one of which still graces my kitchen today. What was special about his work was its tangibility – the purpose behind everything he built was so that someone else could use it, and he could describe his profession by talking about particular techniques and tools, his workshop, or the objects he created.

In today’s twenty-first-century working world, we no longer have such down-to-earth objects. More and more often, we work with virtual information or must make sense of complex structures, abstract knowledge, or vast quantities of figures, data, and facts. The reason that we often struggle with this can be explained by one simple number: seven. Better stated: it can be explained by “Miller’s Magical Number.”

“Miller’s Magical Number” – Or, Why We Can Typically Only Remember Seven Things at a Time

One of the most frequently-cited topics in the field of psychology is a concept developed in 1956 by George A. Miller: “Miller’s Magical Number.” It is based on the assumption that human beings can only hold seven (plus/minus two) pieces, or “chunks,” of information at a time in their short-term memory. If we were computers, this would mean that we would have such a puny amount of RAM that it could hold an average of only seven items!

It is important to take this into consideration when we are trying to represent complex topics on posters.

The Three Most Important Rules for Visualization with Posters

If we adhere to the theory of Miller’s Magical Number, we can assume that we can best process information if we can visualize it by summarizing it into no more than seven, and preferably only five, “chunks.” To do this, we need to learn to cluster information and create logical hierarchies for it. When putting together a poster, it works best to think and work in these three levels: macro, meso, and micro.

MACRO – The overall effect: how striking is the poster? Does it have a special look? Does it come across as interesting, attractive, engaging? The overall effect is best observable from about 10 meters (30 feet) away, and the more vivid the primary images and colors, the more effective the poster.

A good strategy is to choose a flashy central image or a real eye-catcher – and don’t forget about the power of color!

MESO – The structure: which areas of the poster are clearly discernible and how are these areas connected to each other? Is the observer’s glance led through the right elements? You need to get about 10 meters (30 feet) away to be able to determine this.

A good strategy is to use a maximum of seven different “chunks” of information and present these in container layouts, using lines and arrows to separate and connect them, and using color to differentiate them. Clearly organize the headings and illustrations for the individual areas.

MICRO – The content, figures, data, facts: what needs to be conveyed in detail, and is the meaning obvious or does it require some explanation? You should be able to read these details from a distance of about one meter (three feet).

A good strategy is to use color, pictograms, text, graphics, and figures to create a logical flow and to meaningfully visualize the details. Be sure to use an appropriate amount of text, to write legibly, and to use illustrations that have an explanatory or narrative quality.


If you succeed in creating a poster concept that presents complex information in a structured and hierarchical manner, the advantages to the readers are clear: the poster remains in the room and anyone who is so inclined can use it to jog their memory, refresh their short-term memory, or to concentrate on the individual sections of the poster.

MORE ARTICLES ON THIS TOPIC

You Might Also Be Interested In...

sharing iPad screen in MS Teams using CamLink and OBS

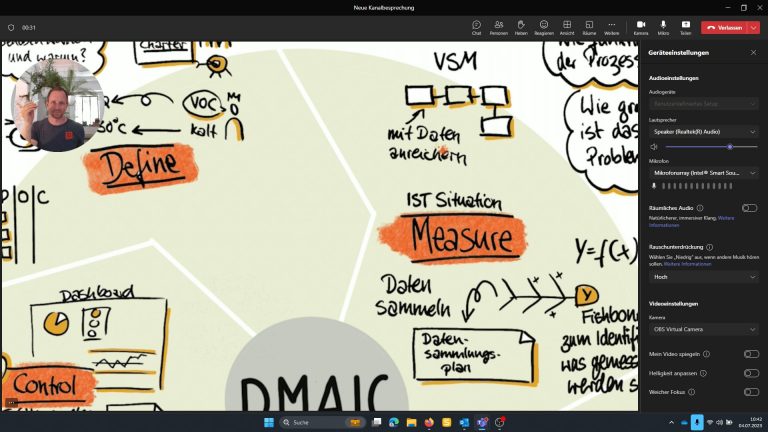
How to use your iPad instead of the webcam in MS Teams

Why do I want to connect the iPad to MS Teams (or Zoom)?
I would like to be able to show my iPad Screen as a tile in the normal Teams window. It should be subtle and not by sharing my screen to draw to much attention and to have a seamless switch between different views. I can i.e.
• document the meeting using OneNote or ProCreate
• easily zoom into pictures or drawing
• easily annotate pictures or digital whiteboards
• using the drawing feature while presenting your content

Hiromi Hara

Design Thinking and Visual Thinking – a perfect fit?

In a recent interview Hiromi Hara speaks about her experience with applying the design thinking method with the help of visualization.
Hara explains that design thinking is not primarily about problem solving, rather about unveiling complex problems and getting better insight in the root cause of issues, hence the importance of the expression of individual perception and the comprehensible yet memorable depiction of thinking processes.

Using Visuals in Coaching

How our global trainer Jill Greenbaum got into drawing and which impact visualization has got on coaching situations.