Belief #1: The simpler, the better.
Not necessarily. You could, of course, attempt to draw the world using only three lines – as long as it truly helped the observer to better understand your point. Usually, though, one of the greatest challenges for visualizers is to strike a balance between including the necessary amount of information and the desire to keep things simple. Albert Einstein is reported to have said: “Everything should be made as simple as possible – but no simpler.” Depending on the context and the topic, three lines may actually be all you need – sometimes, though, more is required.

Belief #2: The more creative, the better.
It depends. If you need to explain something complex, it’s often best to use the simplest and most common pictograms. A heart stands for love; thunderclouds represent conflict. These symbols may not be particularly original, but their meaning is immediately clear. Of course, if you’re trying to build in an element of surprise in a presentation, more unconventional visual translations will be more effective.
Belief #3: Every piece of content must be visually illustrated.
No. Pictograms are intended to clarify information and provide orientation – just like street signs. The more signs that line the street, however, the less able are you, as the driver, to read what is on each of them. Pictograms are also visual anchors, and they can only provide orientation if they are precisely positioned.
Belief #4: Every pictogram has a specific meaning.
No. Pictograms only have the meaning that you assign to them – and that meaning is frequently understood only in context. A light bulb may symbolize a new idea or it may represent the energy consumption of a household – it depends upon how it is being used. Because of this, every pictogram needs a spoken or written word that clarifies its meaning.


Comics for Learning: How to Tell Stories That Inspire
Hand-drawn comics are more than entertainment: they are a powerful tool for educational content. We show you how to turn your messages into compelling stories.

Emotion Figures – Your Key to Vivid Visualization
With just a few strokes, create a big impact:
Learn how to draw figures that make emotions and interactions visible. Simple, systematic, and immediately applicable.
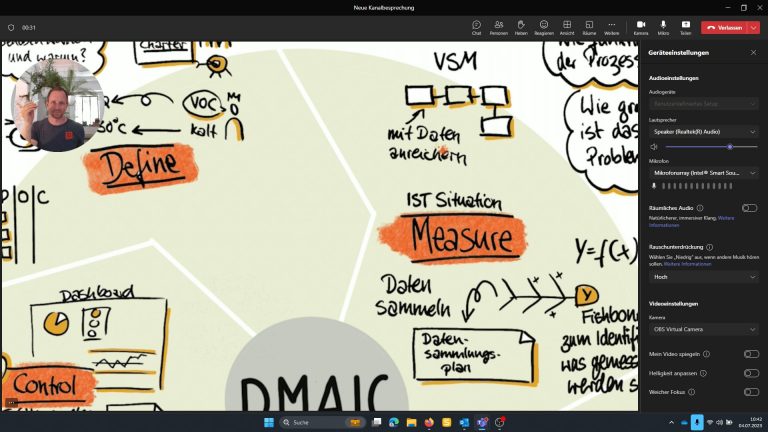
How to use your iPad instead of the webcam in MS Teams
Why do I want to connect the iPad to MS Teams (or Zoom)?
I would like to be able to show my iPad Screen as a tile in the normal Teams window. It should be subtle and not by sharing my screen to draw to much attention and to have a seamless switch between different views. I can i.e.
• document the meeting using OneNote or ProCreate
• easily zoom into pictures or drawing
• easily annotate pictures or digital whiteboards
• using the drawing feature while presenting your content