So let’s take a closer look at our complicated “huh-sentence”.
Admittedly, sometimes when it comes to complex content, we visualizers feel like deer caught in the headlights. “EMEA – US – Client – Sales Agent?” Even I didn’t understand at first what all of this meant. This is why I draw what I have understood step-by-step. Each step becomes, at the same time, a question to the speaker – am I presenting this correctly?
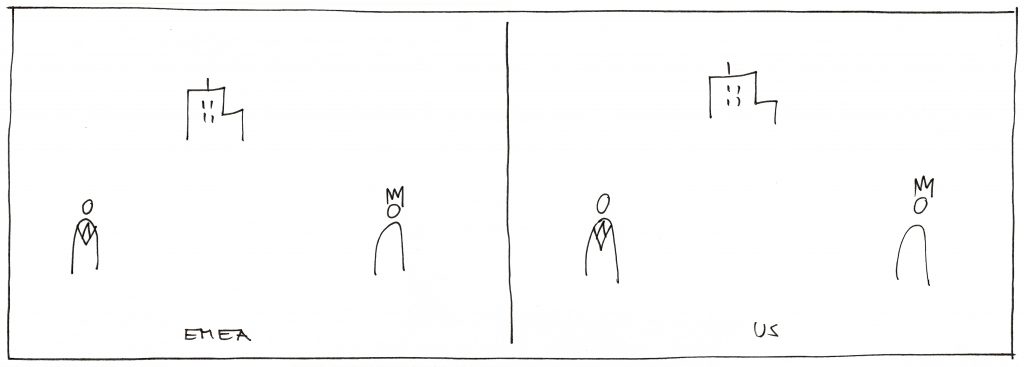
Step One: understanding the basic structure of the content.
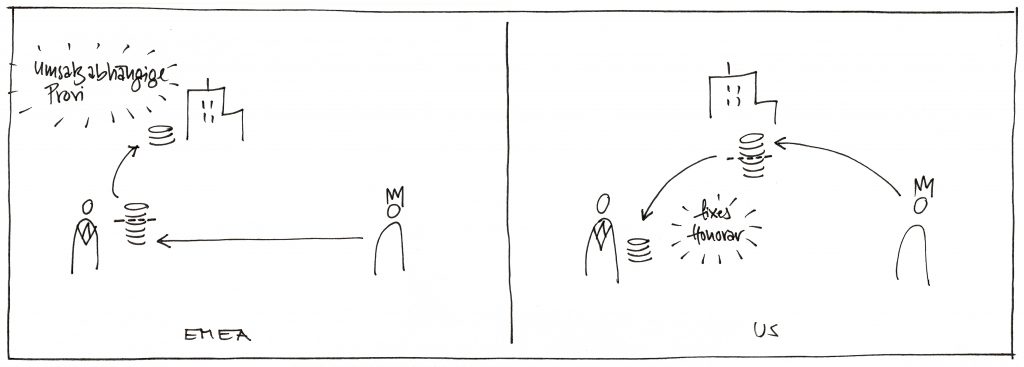
I start with what I have been able to understand. At first, it isn’t much: EMEA (whatever that is) and the US appear to be two different “systems” that need to be represented in contrast to each other. I will therefore divide my paper into two sections and give each of them a title.

I then go back to the speaker with a question: have I understood this correctly? If not, I take a new sheet of paper and start over.
Step Two: Identifying the players and key elements.
In both of these systems, there appear to be three identical “players”: the sales agent, the company, and the client. To represent these, I choose the simplest image that spontaneously occurs to me. And then I repeat my earlier question: “Is this right? Is anything missing?”

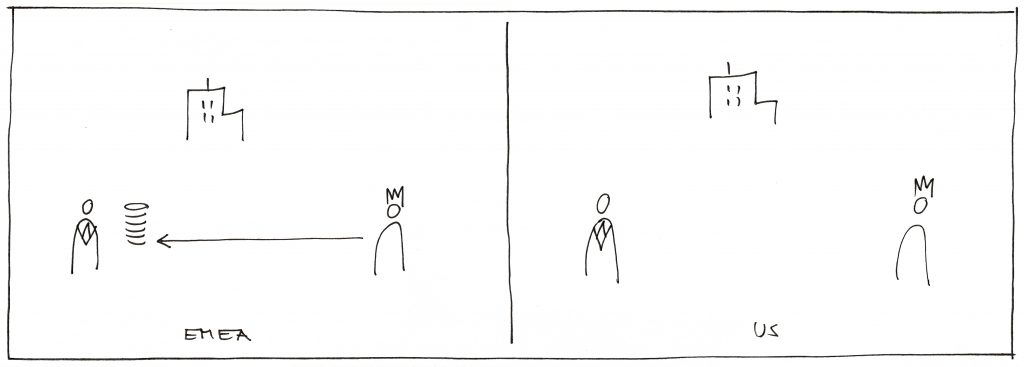
Step Three: show the interrelationships.
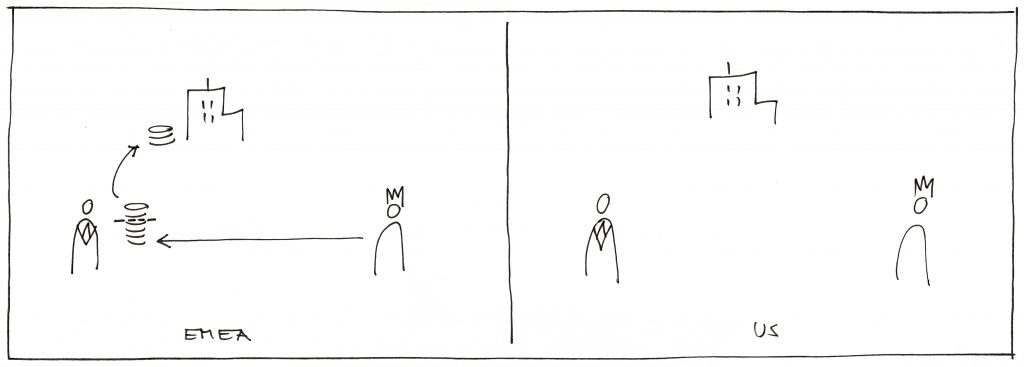
These three players all appear to have specific business relationships with each other, and that seems to be the sticking point. In the “EMEA” system, the client pays the sales agent …
… and the sales agent pays a portion of this money to the company – the commission.
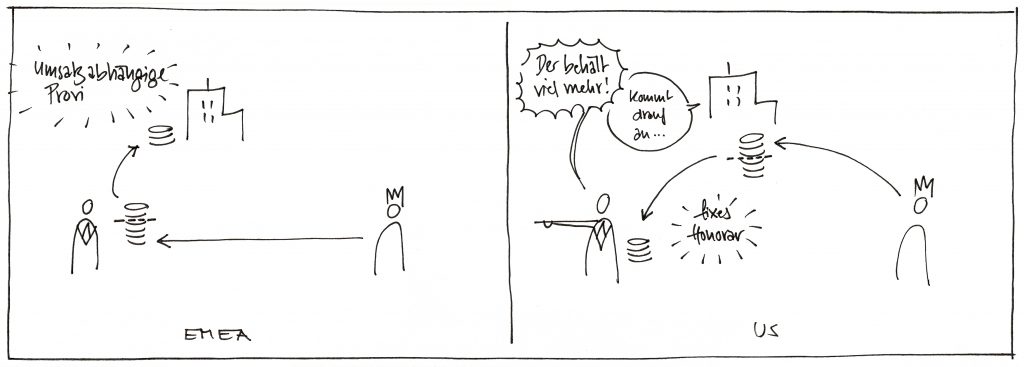
It’s different in the “US”. There, the company bills the client. At this point, it is a good idea to rethink everything, so as to stay within the logic of the “EMEA” system. What is happening with the billing is that it is reversed: the client pays the company and then the company pays a portion of this to the sales agent – the fee.
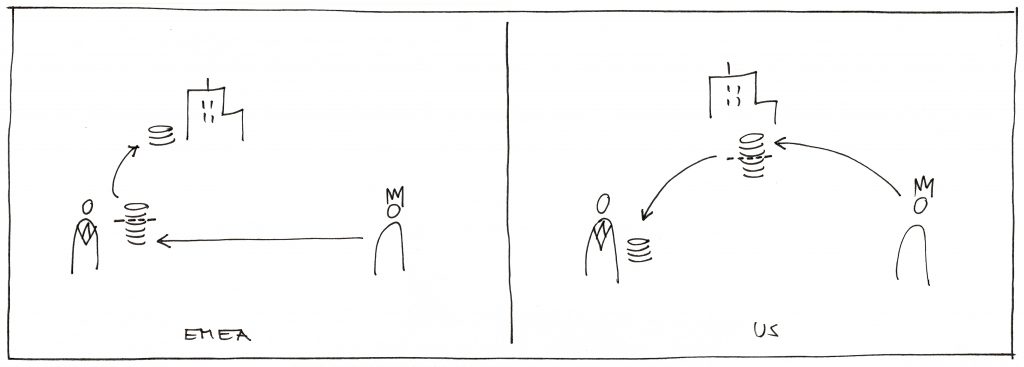
But: how can we visualize “a commission based on the earnings” or a “fixed fee per item sold?” One tip: visualization means “image plus graphic plus text.” If you can’t immediately come up with a suitable image, just write it down.
Ask for clarification from the speaker – and keep drawing!
It’s time once again to ask the speaker: “Have I understood this correctly?” It might be that he or she will say: “Yes, exactly, and this is also important . . . “ —and will take the pen and complete the sketch themselves. Or, you might hear: “I realize now that I’ve made a mistake in my thinking here – let me try to draw it myself.”
So, you see: even when you are visualizing complex business processes, drawing helps you to make detailed content clear to both yourself and to others. In the process, always check – as in this example – that the visualization represents a mutual understanding of the situation, and on this basis, collaborate on further developing ideas or concepts. And, perhaps the result will be the quick clarification of a misunderstanding or a difference of opinion – or the issue that is at the root of them!

Comics for Learning: How to Tell Stories That Inspire
Hand-drawn comics are more than entertainment: they are a powerful tool for educational content. We show you how to turn your messages into compelling stories.

Emotion Figures – Your Key to Vivid Visualization
With just a few strokes, create a big impact:
Learn how to draw figures that make emotions and interactions visible. Simple, systematic, and immediately applicable.

Visualization as a tool for dialogue in conflict regions
With a flipchart on my motorcycle, I reach remote border villages in northwestern Côte d’Ivoire. There it becomes clear: visualization can enable dialogue, build understanding, and mobilize communities toward shared solutions—even where words alone are not enough.